
What is the purpose of a marketing campaign? It depends on who you ask.
Ask the CEO of a company, and they’ll most likely say something along the lines of “drive more sales, make more money.”
Ask someone from the company’s marketing team, and they’ll typically focus on something much more specific to the actual campaign – be it generating brand awareness, collecting better leads, keeping customers on board…you get the idea. That said, one of the marketing team’s main duties is to be able explain to the C-suite execs how this or that marketing campaign will tangibly affect the company’s bottom line.
Unfortunately, it’s not uncommon for marketing teams to come to the table with a list of data points that make it look like they’re accomplishing their goals – but that really don’t make a difference to the company’s revenues and sales numbers. Even if a specific marketing campaign truly has been effective, it’s not going to reflect well on the marketing team if they aren’t able to nail down exactly how effective the campaign actually was.
With that in mind, let’s continue:
The ultimate goal of marketing is to drive sales and increase revenues. But, as you know, typically, the modern consumer doesn’t just wakes up and decide to make purchases out of the blue. On the contrary, consumers usually need to “warm up” to a brand before they decide to open their wallets. This means you need to create marketing campaigns and content aimed specifically at making new potential customers aware of your brand – and forging a trusting relationship with these individuals.
The problem here is that “awareness” and “trust” don’t necessarily translate to dollar signs – which, again, often causes a rift between executives and their marketing teams. However, without these things in place, your company stands little chance of generating revenue from new customers.
It’s important for marketers to know which metrics, at each stage of the buyer’s journey, actually mean something in the grand scheme of things.
Awareness Stage Marketing Metrics
It’s difficult to tie metrics and stats of the initial stage of the buyer’s journey to a company’s bottom line. Unfortunately, this is why many organizations tend to fall back on “vanity metrics” at this stage. You know the usual suspects: pageviews, social media followers, likes/hearts/favorites, etc.
As Sarah Dawley of Hootsuite points out, vanity metrics are only vanity metrics if you fail to understand – and fail to explain – how they affect your company overall. In other words, such metrics might not mean much on their own…but can tell you a lot about the effectiveness of your marketing campaigns upon further inspection.
Let’s dive a bit deeper then, into awareness-related marketing metrics that matter.
Website Metrics
One of the biggest mistakes novice marketers and entrepreneurs make when creating a website is focusing on pageviews.
Take the following chart, for example:


(Source)
Looks pretty awesome, right?
Unfortunately, that massive spike was caused by a bot infiltration to the website. None of those machines ended up becoming paying customers – so the spike in traffic means absolutely nothing.
Even if that spike in traffic was legitimate, you’d still need to dig deeper to determine whether or not it was directly related to your marketing initiatives – specifically, your inbound marketing initiatives.
First and foremost, check out your organic traffic numbers, as well as your unique visitor numbers. These numbers will tell you how many times your site has been legitimately visited, as well as how many of these visits can be attributed to brand new visitors. You can track this metric using Google Analytics, as shown in the following screenshot:


You also want to take note of which pages your visitors frequent the most. This will give you a good idea of the keywords that you’re ranking well for and that effectively attract visitors to your site. In turn, you can then focus on creating more content related to these topics moving forward.
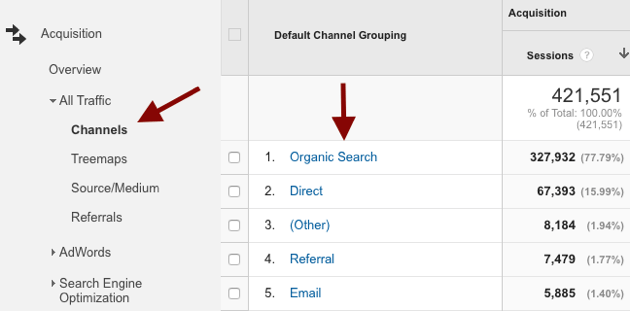
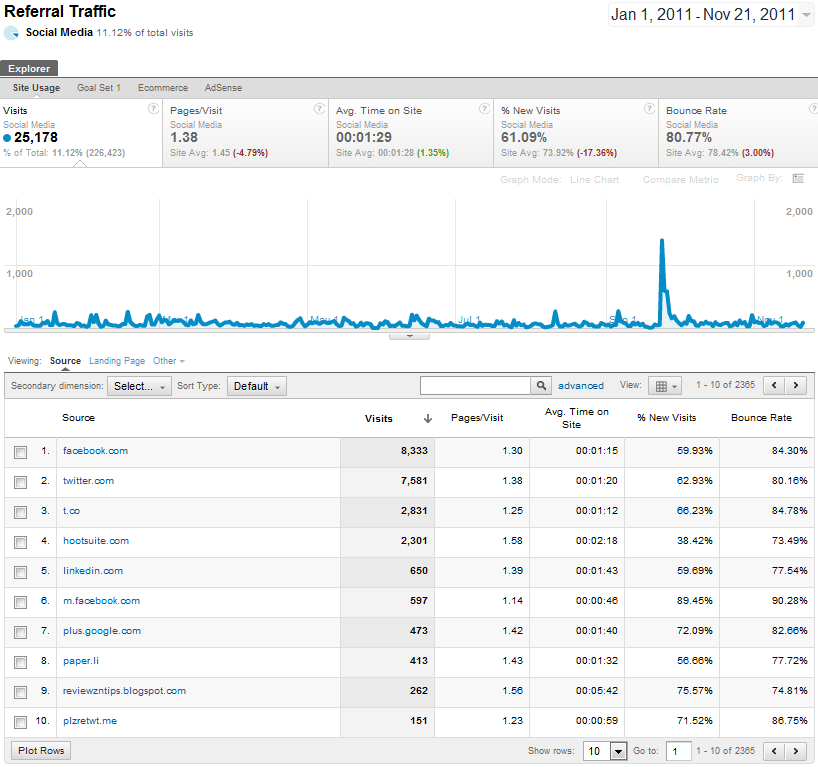
Finally, take a look at where your traffic is coming from. When you’ve created marketing campaigns (or created marketing opportunities) on third-party sites, this is one of the best ways to know if such initiatives have been effective. In the example below, it’s clear to see that a decent chunk of this site’s visitors come from Facebook and Twitter.


Social Media Metrics
While follower count, likes, and shares tell you that x amount of people are “aware” of your brand, this “awareness” doesn’t exactly cross the threshold of being meaningful from a business perspective.
Rather than looking at the size of your following, your best bet is to look at the growth rate of your social media audience. To do so, determine the number of followers you’ve gained over a certain period of time (e.g., a month, quarter, or year), and divide this number by your total amount of followers. You can then compare this number to previous time periods – or to the growth rate of your competitors during the same period of time.
You’ll also want to measure your post reach rate – the percentage of individuals who actually saw your post, compared to the total amount of followers you intended to present it to. For example, if you have 1,000 followers, and 100 of them saw the post over a given period of time, the reach rate for the post would be 10%.
Taking reach rate a step further, you can also determine your post’s potential reach, as well. This requires you to determine how many total individuals follow the people who have shared one of your posts, then taking roughly 2-5% of that total number. Every time someone shares one of your posts on social media, you can expect it to reach up to about 5% of their audience.
One last – incredibly important – metric to focus on is social share of voice. This number essentially compares the amount of times your brand is mentioned on social media, as compared to the number of times all brands within your industry are mentioned. To calculate social share of voice, follow these steps:
- First, collect a list of competing brands’ social media handles
- Then, determine the number of times your brand was mentioned on a given social media channel
- Determine the total number of mentions all brands within your industry (yours included) received
- Divide your number of mentions by the total, and multiply by 100
The goal of these metrics is to wrap context around what we originally saw as vanity metrics. That way, it becomes easier to say “Hey, we gained fifty new followers this month – and here’s what that means to the company.”
Consideration Stage Marketing Metrics
When focusing on the consideration stage of the buyer’s journey, you’ll be looking to create content that engages those who have at least shown a decent amount of interest in your brand.
Below are a few metrics that can provide valuable information regarding the effectiveness of your consideration-stage marketing campaigns.
Website Metrics
At this stage, things start to become clearer in terms of which metrics actually matter – and which are superfluous. You’ll want to focus on metrics that explain how often – and for how long – individuals visit your site. Additionally, you’ll want to start paying closer attention to what they actually do once they get there.
One important metric to identify is the amount of returning visitors your site generates over a given period of time. The more times an individual visits your site, the more interested they are in what you have to offer – and the likelier they are to eventually become a paying customer (that is, compared to one-off visitors).


(Source)
Also worth noting is the time your new and returning visitors spend on your site – and on specific pages within your site, as well. Of course, the pages on which your visitors spend the most time are clearly those which they find most interesting – and are the ones you should focus on modeling the rest of your site after.
(Conversely, pages with a high bounce rate and low time on page should either be tweaked as appropriate, or perhaps scrubbed from your site altogether.)
Finally, you want to assess the success rate of your site’s various CTAs – whether they point to further reading, a subscription form, or a product page. Essentially, this means checking either a CTA’s click-through rate (for those simply pointing to another page) or conversion rate (for those attached to a form of some sort).
Social Media Metrics
Once again, when it comes to measuring the success of your social media marketing campaigns, you’ll almost always start by looking at the infamous vanity metrics.
Regarding the number of “likes” or “favorites” from a post, you want to look at the ratio of these “thumbs ups” to the total number of people you intended on presenting the post to. This metric – your “applause rate” – is calculated by dividing the number of “likes,” etc., that your post generated by your total follower count.
(Quick note: You might also choose to look at the ratio of likes to impressions, as well, since this will tell you how many people “liked” your content out of those who actually saw it. However, using the like-to-follower ratio will also provide insight into whether you’re reaching your intended audience with quality content or not.)
You’ll also want to measure your amplification rate – that is, the percentage of your audience that shared one of your social media posts. Along with this, you can take a look at a given post’s virality rate, calculated by dividing the amount of shares the post received by the number of impressions it earned.
Decision Stage
Here’s where things become more broad, in that we’ll be focusing on the overall impact that all of a company’s marketing efforts have on the organization’s bottom line.
Your first order of business should be to explain the cost of your marketing campaigns and efforts in relation to the cost of acquiring customers overall. Basically, you’ll divide the cost of a given marketing campaign by your total CAC (your marketing costs plus your sales costs). By comparing this number against that of your most successful campaigns in the past, you’ll get a pretty good idea of what’s working well – and what isn’t.
Additionally, you want to track your marketing-originated customer percentage, as well as your marketing-influenced customer percentage. These numbers tell you how many of your new customers (as compared to your entire new customer cohort) were attracted to your site specifically by a specific piece of marketing material – or, at least, whether they engaged with this content at some point before converting. While this isn’t to say that such content was the reason an individual became a paying customer, you definitely shouldn’t overlook the fact that it had something to do with the process.
One last piece of data to consider when focusing on the conversion stage is what percentage of your marketing-qualified leads ended up becoming paying customers.
(Note: The percentage of MQLs that become SQLs is typically anywhere from 30-40% – with about 30% of those individuals becoming paying customers. So, your MQL-to-conversion percentage should be about 9-10%.)
As we’ve spoken about before, the marketing team’s job isn’t over once they’ve passed a lead on to sales. Furthermore, the marketing team’s job isn’t to just attract any potential customer – it’s to attract the right customer for the company – one that has a high chance of converting.
The ultimate goal of any marketing team is to increase sales- and revenue-related metrics. As we’ve alluded to throughout this article, a surface-level metric that doesn’t relate in some way to conversion is merely a vanity metric; on the other side of this, though, what may seem like a vanity metric can actually be an essential piece of the puzzle if it can be traced to an increase in conversions.
Further Reading for Beyond the Decision Stage
Now, the buyer’s journey certainly doesn’t end once an individual has made a purchase – that is, ideally it doesn’t. If everything goes according to plan, you’ll have generated a new customer who will not only engage with your brand time and time again as time goes on, but will also sing your praises to other like-minded individuals in their network.
Of course, you’re probably going to need to nudge them a bit in order to get them to take either of these actions. And, of course, you’re going to want to be able to gauge your ability to do so.
Luckily, we at PostFunnel have already discussed the most important metrics to focus on when assessing the effectiveness of your retention campaigns and referral initiatives. Check out those articles, as they go much more in-depth than we have room to do here.
And, as always, let us know what metrics you use when assessing the effectiveness of your marketing campaigns. We’d love to hear from you!